Main Dashboard: One Analytics Home for Every Role
August 10, 2026
Start from a role-based preset, customize it for your own workflow, and keep the original preset untouched.
One product, different first questions
Product analysts, UA managers, and monetization teams rarely need the same dashboard when they open an analytics platform. A UA manager cares about spend, installs, and ROAS by source. A product analyst starts with retention and cohort behavior. A monetization lead is more likely to watch ARPU, ARPPU, and the split between in-app and ad revenue. A single fixed home screen fits one of them and leaves the rest scrolling.
Giving everyone an entirely private workspace creates the opposite problem: there is no common starting point, and no signal about which view the team actually stands behind.
The new Magify Main Dashboard is built to solve both at once. Teams get centrally maintained presets for common roles, and every user can customize their own view without changing the preset for anyone else. The model underneath is three words: shared metrics, shared presets, personal views.
Start from a preset
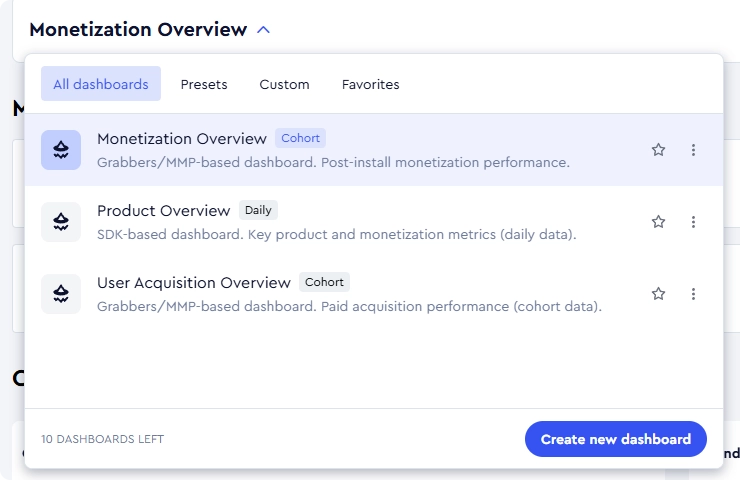
Presets are role-oriented dashboards published and maintained by Magify's product team — ready-made starting points for common workflows, such as a marketing overview. Nothing a user does changes them. Any preset or custom dashboard can later be set as a personal default.
Make it yours without changing it for everyone
This is the mechanic that makes the two-layer model work: editing a preset produces a custom copy.
Say a UA manager starts from the marketing preset but wants revenue broken out by app and a different set of columns in the applications table. As soon as they make the change, Magify saves the result as a personal custom dashboard while leaving the original preset untouched. There is no "save as" to remember and no way to overwrite a preset by accident. The practical effect is that a preset stays a stable reference: everyone starts from the same dashboard structure, while data visibility still follows individual access permissions.
If you'd rather branch deliberately, Make a copy does the same thing on purpose — start from a preset, or from another custom dashboard, and edit the copy. Either way, edits are personal: they save to your account and no one else's.
A dashboard doesn't have to begin life as a copy at all. You can create one from scratch, give it a name and a description, and mark it as your default at the moment you create it — worth doing when the view you actually work in has little in common with any of the published presets.
Shared metrics, personal layouts
Personalization applies to dashboard composition and widget configuration — which widgets you show, how they're arranged, which series or splits are active, and which columns appear. It does not extend to the metrics themselves.
The metric catalog is managed centrally. When the team adds a metric, it enters the central catalog available across dashboards. When it removes one, the metric disappears from every dashboard, custom ones included; removals are announced ahead of time with a banner and the affected metric is flagged, and new metrics arrive with their own notice. Where a metric has a definition or formula, it is exposed in the tooltip. The advance warning matters most for dashboards people built themselves: a metric you check every morning does not vanish from your own layout without notice.
That division is the point. Layouts are personal because workflows differ; metric definitions are shared because the meaning of a KPI shouldn't depend on who opened the dashboard.
One dashboard, three ways to read the business
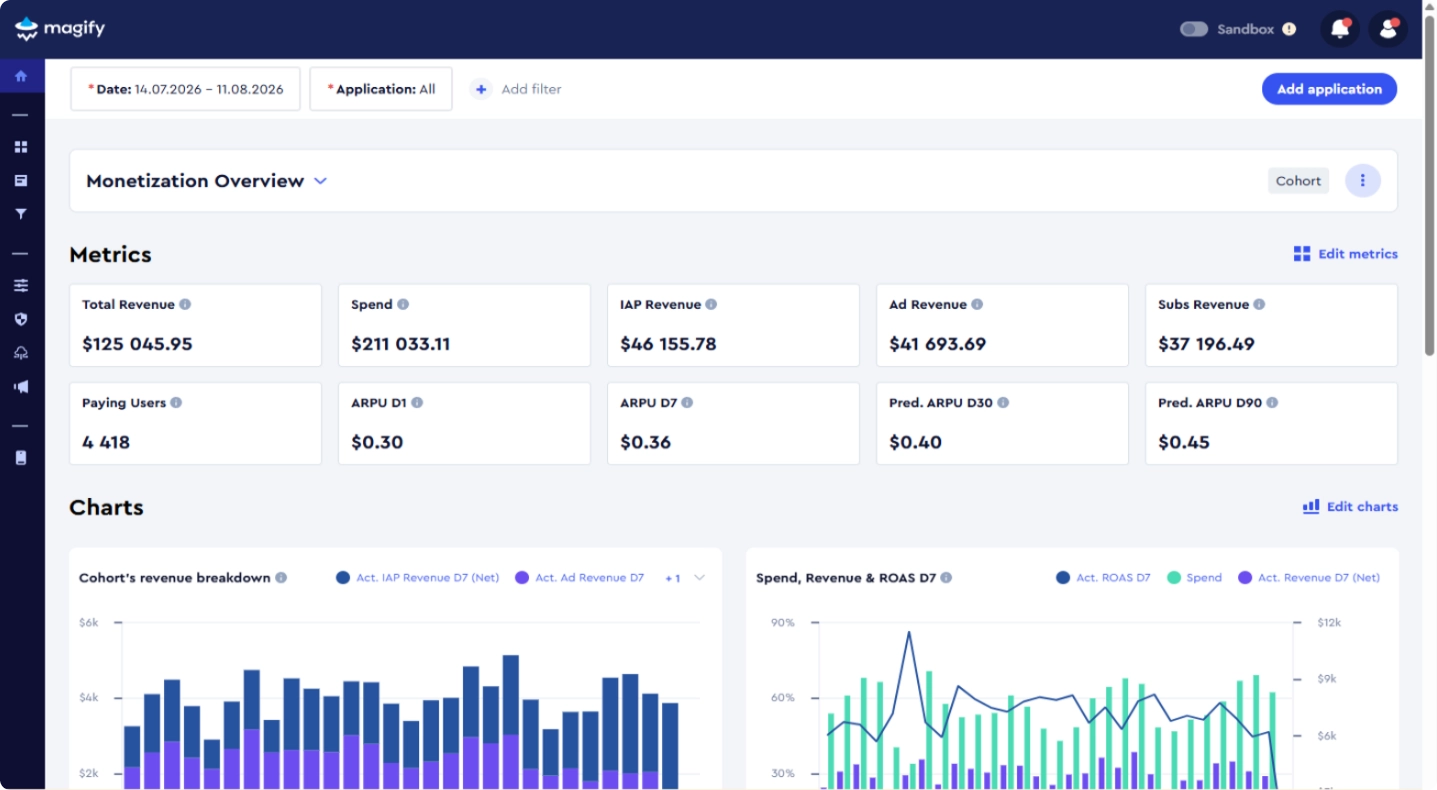
Main Dashboard is assembled from three widget types, and they map to three levels of investigation rather than three chart styles: what changed, how it changed, and where it came from.
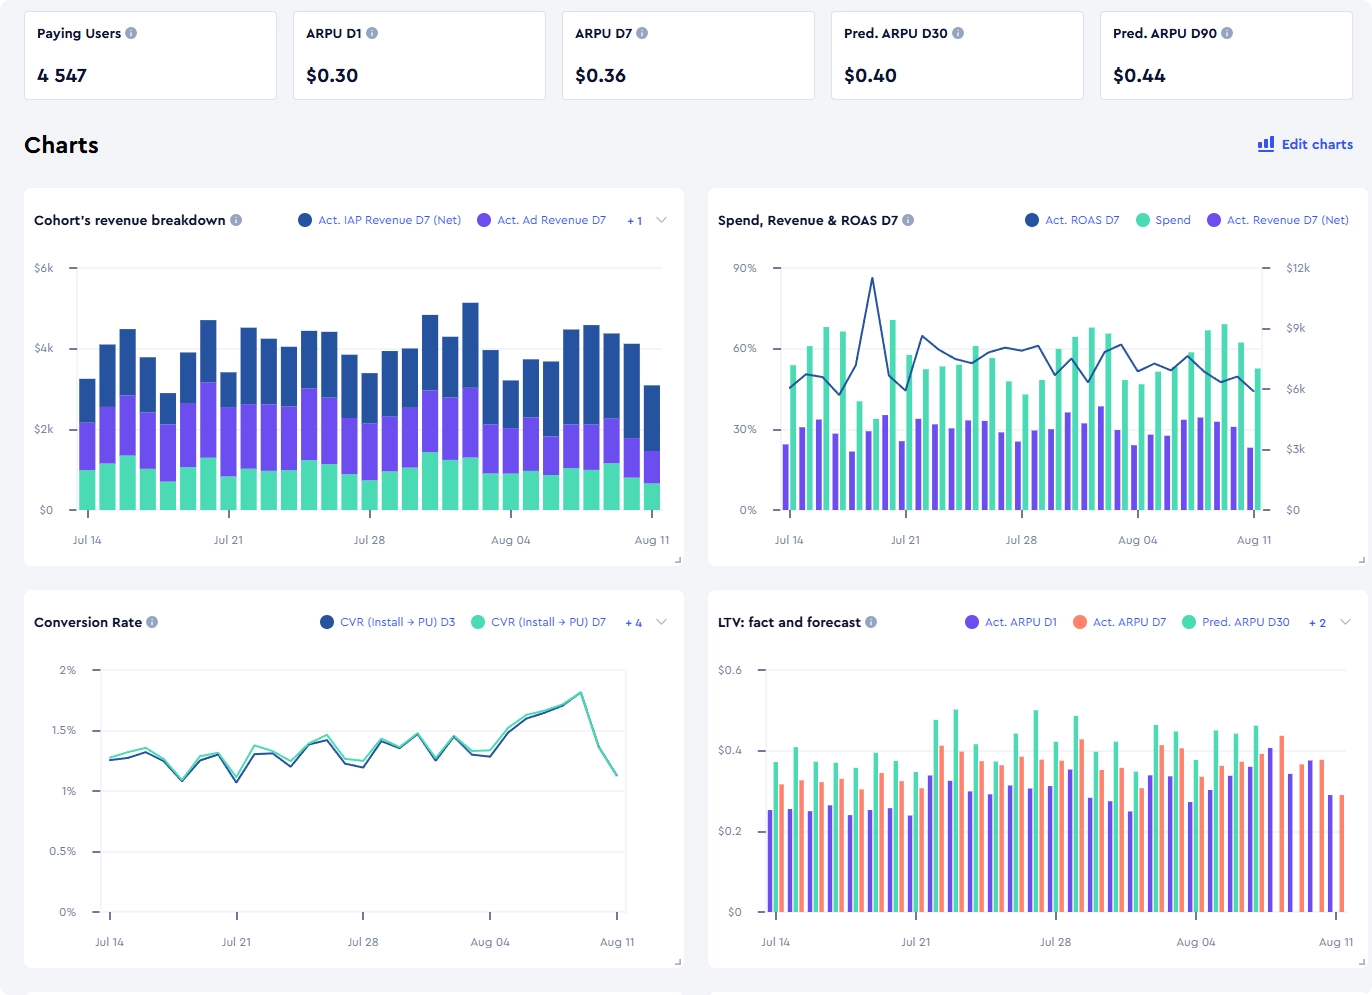
Metrics cards answer the first question: what changed? Each shows a current value and its delta, with a definition or formula in the tooltip where one exists.
Charts answer the next one: how did it change over time — is the movement recent, persistent, or short-lived? They are time series with series and split toggles where the metric supports them — Day 1 / 7 / 30 retention windows, or total revenue split into in-app and ad, to use the product's own examples.
The Applications table answers the third: where is that movement coming from across your apps? It lists one row per application plus a Total row, with sortable, configurable columns.
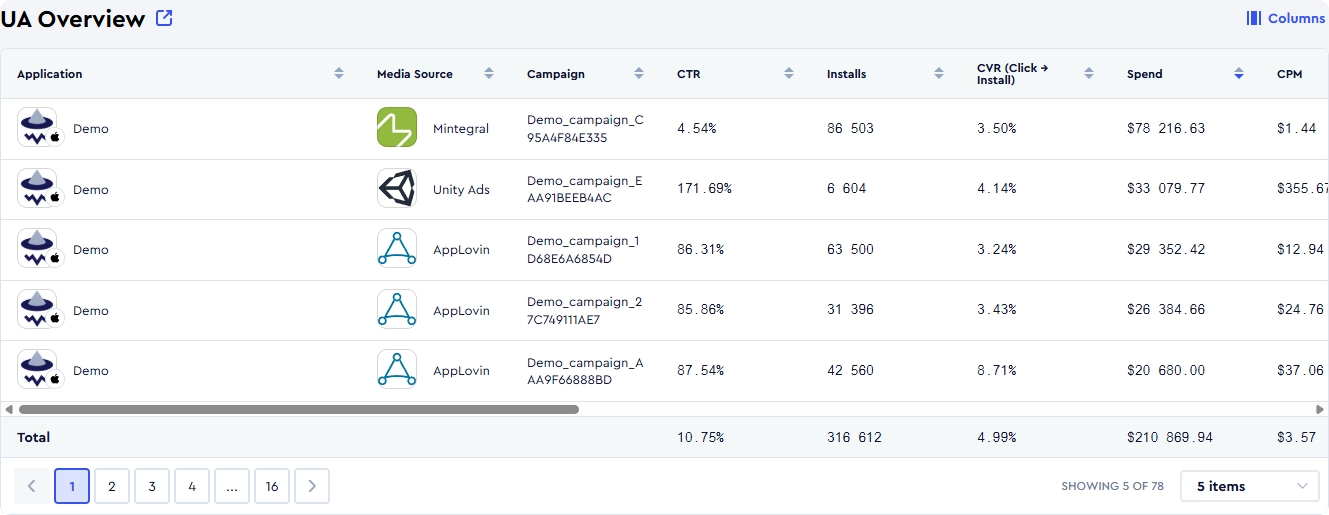
The same two global filters, Period and Applications, recalculate all three layers together, so you can move from a top-level KPI to a narrower portfolio cut without rebuilding the analysis. More specific dimensions — Media Source, Campaign, Platform, Country, App version — are available when a question needs deeper segmentation. Switching between presets keeps the current Period and Applications selection in place, so moving from one role-based view to another continues the same investigation instead of resetting it.
Gaps in the data are handled per widget rather than per dashboard. If the current filters return nothing for a given metric, that widget says so explicitly instead of rendering a zero, and a widget that fails to load fails on its own without taking the rest of the screen down with it.
What that looks like in practice
The following is illustrative, not a reported result.
A UA manager opens the marketing preset for the last 28 days across all apps. A KPI card shows blended ROAS down against the previous period — the delta catches the eye before the absolute number does. They narrow Applications to the two titles carrying most of the spend and apply a Media Source filter to isolate a channel. The applications table shows that most of the observed decline is concentrated in one title.
It turned "ROAS looks off" into "this title, this source, this period" — a place to start a decision about budget, not a conclusion about cause. The dashboard identifies where to investigate; it does not turn an observed movement into a causal explanation.
Your landing screen
One more setting makes that personal workspace easier to return to. Set as my default pins any preset or custom dashboard as the one Magify opens into on refresh, after the browser is closed, and on the next session — so each person lands directly in the view they use most, without navigating to it first.
That is what closes the loop on the opening problem. Presets cover the views Magify maintains centrally; custom dashboards cover the way individual people actually work. The default is what connects the two: whichever of them you spend most of your time in becomes the screen the product opens into, and the same platform can open into a marketing view for one person and a retention view for another.
What stays centrally managed
Two boundaries are worth stating plainly. Presets are centrally managed rather than user-published: users can create as many custom dashboards as they need, but they cannot publish them as presets themselves. And the metric catalog is global by design — individuals don't add or remove metrics, which is exactly what keeps definitions consistent across the product. Visibility, in turn, follows each user's analytics and configuration permissions, applied per organization and per application.
A shared starting point, a personal workspace
Main Dashboard gives teams a common analytical starting point without forcing everyone into the same workspace. Magify maintains the presets and the metric catalog underneath them; each user decides which view they want to return to and how that view should be organized.
Shared where consistency matters. Personal where workflow does. Main dashboard documentation
What to read next

Introducing Refund Saver: Automated App Store Refund Management in Magify
Meet the new UA Report Acquisition, monetization, and predictions in one view