Meet the new UA Report
April 9, 2026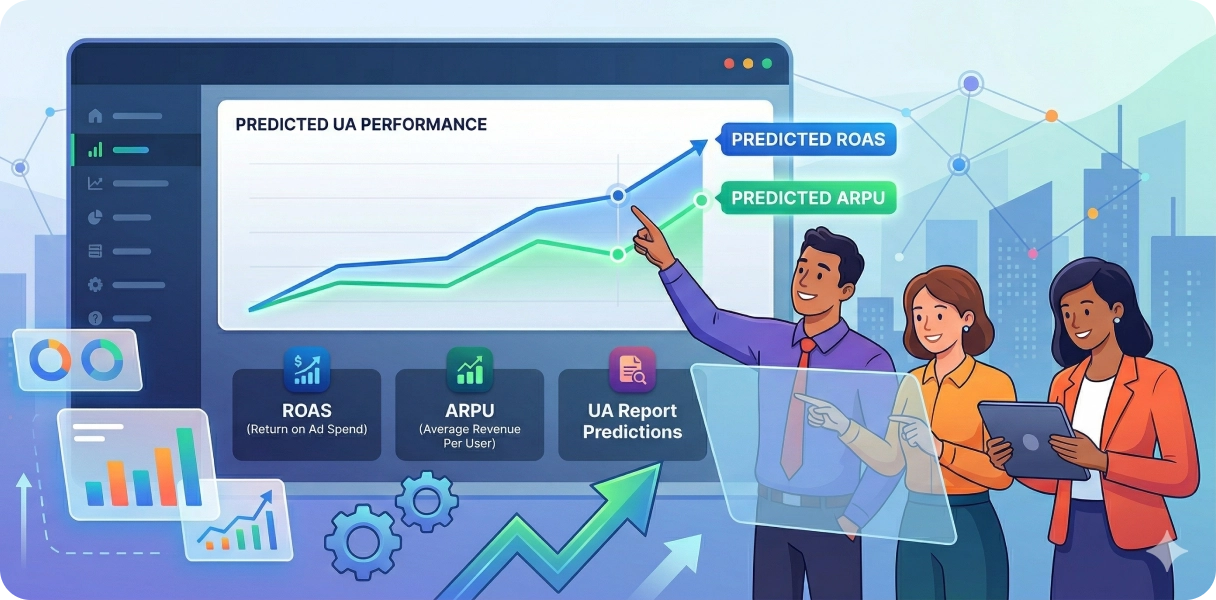
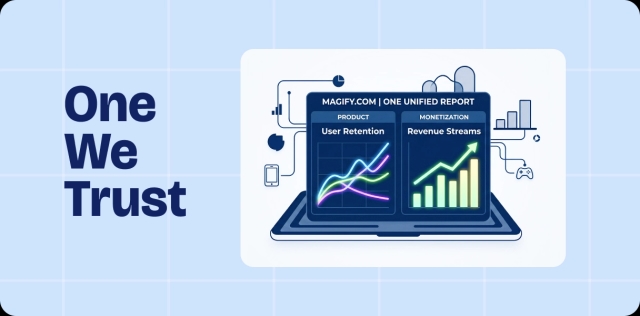
Acquisition, monetization, and prediction in one view
We’ve rethought UA analytics from the ground up.
The new UA Report brings together what used to live separately: UA performance analysis and predictive payback modeling. Instead of switching between a reporting view and a forecasting view, teams can now evaluate acquisition efficiency, cohort monetization, and future return in one place.
Built on top of our new Data Lake foundation, the report gives teams a faster, more consistent, and more scalable way to analyze traffic quality over time. It is designed not just to show what happened after install, but to help answer the bigger question: which users are truly worth acquiring$1
For full methodology, filters, and metric definitions, users can explore the detailed documentation in our Help Center: UA Cohort Report and Dashboard.
Why this is a big step forward
UA decisions should not depend on install volume alone.
A source may look efficient on CPI and still bring weak cohorts. Another may look more expensive upfront, but generate better retention, stronger monetization, and healthier long-term payback.
That’s why the new UA Report goes beyond acquisition metrics. It connects traffic data with player monetization, making it possible to analyze not only how users were acquired, but also how they generate value over time.
This means teams can evaluate:
- acquisition cost,
- cohort revenue,
- ROAS,
- payer conversion,
- retention,
- subscription performance,
- and predicted future return from the same analytical flow.
From traffic quality to monetization quality
One of the most important upgrades in the new UA Report is that it does not stop at the acquisition layer.
Teams can now analyze traffic not only by media source, campaign, creative, country, or platform, but also by what that traffic becomes after install: how users monetize, how quickly cohorts pay back, and which acquisition channels bring the most valuable users over time.
This is what turns UA reporting into a real decision-making tool.
Instead of asking:
- Which source brought cheaper installs$2
you can ask:
- Which source brought better monetizing users$3
- Which cohorts generate stronger ad revenue$4
- Which campaigns convert better into IAP or subscriptions$5
- Which traffic source is actually scaling profitably$6
ROAS with real monetization depth
Another major advantage of the new UA Report is visibility into different revenue streams, not just total revenue.
Teams can evaluate return across:
- total revenue,
- ad revenue,
- IAP revenue,
- subscription revenue.
That makes ROAS analysis much more actionable.
For example, teams can see:
- whether a source pays back mostly through ads,
- whether a cohort is strong on purchases but weak on subscriptions,
- whether subscription-driven traffic needs more time to mature,
- or whether total ROAS is being carried by just one monetization stream.
This matters especially for apps with hybrid business models, where top-level ROAS alone often hides the real story.
Fact and Predict, now working together
Previously, teams had to move between reporting and prediction.
Now those two layers work together in the same analytical logic.
The new UA Report combines:
- Fact metrics — what the cohort has already generated,
- Predict metrics — what the cohort is expected to generate next.
This gives teams both:
- a clear view of actual observed performance,
- and an earlier read on likely future payback.
That is especially valuable in fast-moving UA workflows, where waiting for full cohort maturity can mean reacting too late.
A predictive model built for real UA decisions
Prediction is one of the strongest parts of the new UA Report.
At the core is an ML-based revenue prediction model that uses early cohort signals to estimate future monetization. On top of that, an additional coefficient-based model layer helps refine the forecast and support decision-making across different horizons.
In practice, this gives teams a much stronger prediction framework: one that combines the flexibility of machine learning with the stability of rule-based calibration.
The result is a predictive system built not for theory, but for real UA use cases:
- early payback assessment,
- source quality comparison,
- scale / pause decisions,
- and faster optimization cycles.
If you want, we can make this paragraph even more “product-marketing” and less technical — but as a positioning statement, this is already strong.
Prediction across multiple horizons
The report is designed to predict performance from one observed horizon to another.
In other words, the system can use early factual signals — such as D1, D4, D7, or D30 performance — to project future results at longer horizons such as D7, D30, D90, D180, D360, and D720, depending on data availability and model setup. This helps teams make informed decisions much earlier in the lifecycle of a cohort. Source
That means teams do not need to wait until a cohort fully matures to evaluate its likely long-term value.
Instead, they can start answering critical questions earlier:
- Is this cohort likely to hit target ROAS$7
- Is this source bringing stronger long-term users$8
- Should we scale now, optimize, or stop$9
- Are we seeing early signs of future value that are not yet visible in fact metrics alone$10
High accuracy, low error, better confidence
Predictive metrics are only useful when teams can trust them.
That’s why the new UA Report is built around a prediction framework designed to deliver high accuracy with low error, giving teams more confidence when making early-stage UA decisions.
This is especially important when:
- comparing traffic sources before full payback,
- forecasting long-term ROAS,
- evaluating creative quality,
- or deciding whether a cohort should be scaled.
Instead of treating prediction as an experimental add-on, the new UA Report makes it a practical part of the UA workflow.
Built on Data Lake for the next stage of UA analytics
The move to Data Lake is not just a backend upgrade. It is what makes this new reporting approach possible.
With a stronger data foundation, the UA Report can bring together acquisition, monetization, and prediction into one system — with a more scalable structure for cohort analysis, deeper dimensions, and a clearer view of user value over time.
This is the direction we believe UA analytics should move in: not just measuring the cost of acquisition, but understanding the quality, value, and future return of every cohort.
Want to explore the details$11
This page gives you the high-level picture. For the full methodology, metrics, dimensions, and prediction logic, visit the Help Center: